When the shelf becomes data
 Deepanshu Pal
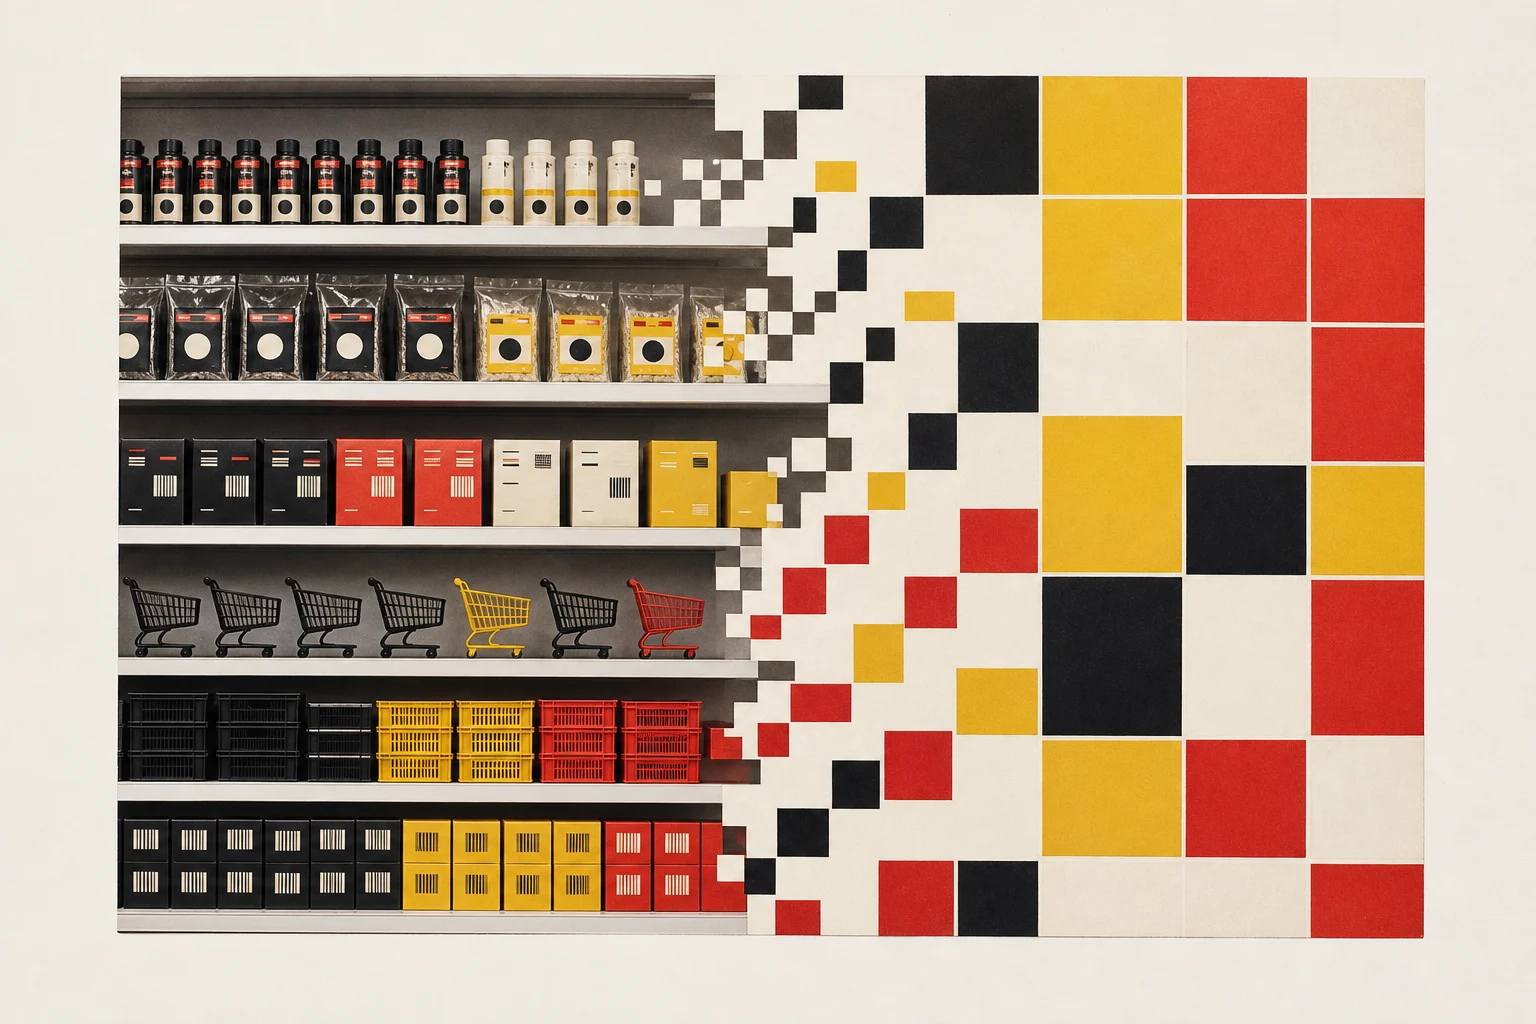
A shelf photo can tell a retailer what is in the store, not only what sold. We built a system that brings those two views together.
The missing resolution
A retailer can know what sold without knowing which row carried it. Product sales and shelf layouts live in separate records. That makes a small merchandising decision hard to evaluate: move a product up a row, add a facing, swap two neighbors. The sale is visible. Its position is not.
From a photo to a shelf map
We built Retail Planogram with a large supermarket chain in Southeast Asia. A team member takes a shelf photo with a phone. The system checks the products against the store catalog, counts the visible facings and records where they sit. A person confirms the results. When a match is uncertain, the system asks for a review instead of accepting a guess.
Closing the gap
The planned shelf is a promise. The shelf actually standing in the store tells you whether that promise was kept. Once the products and their positions have been checked, the system can connect them to sales. That gives the team a way to compare the shelf they planned with the shelf that customers saw.
The work after the audit
The morning list brings the exceptions together: a top seller that stopped selling, empty space and shelves that need a fresh photo. Each shelf report brings revenue, facings and trends onto one page that store operations can use. The goal is to spend less effort recording the shelf and more effort deciding what to fix. We are not publishing a measured time saving or sales lift.
What a shelf photo becomes
The output of a photo is a structured record, not a picture. The shelf, the row and the slot each become a place where a product either is or is not. That is the resolution a sales report was missing.
Shelf
The unit in the store, with its capture history and when it was last photographed.
Row
A horizontal level of the shelf, so a product can be placed higher or lower.
Slot
A single position in a row, so facings can be counted and compared with the plan.
Once the shelf is a record, a question like "did the product that stalled lose a facing last week?" becomes one that can be asked.
Why a person stays in the loop
Computer vision is good at most of a shelf and unsure about some of it. Packaging looks alike, products are partly hidden and labels face away. Rather than guess, the system flags the uncertain matches and a person confirms them. The record stays accurate, and the team spends its attention on the few cases that need it.
Where the data stays
The deployment runs on the retailer's own hardware. Shelf photos and sales data stay on site. Keeping that data on site is a design choice, and it has costs as well as benefits.
What we can share
The client remains unnamed. Public demo dashboards use fictional store names and illustrative sales figures, not customer results. The workflow described here is the deployed system; the diagram explains its steps without claiming a measured outcome.
How the work moves
- 01
Photograph the shelf
- 02
Check the products
- 03
Confirm the results
- 04
Connect the sales
- 05
Decide what to fix
The machine customer.
Commerce has a new reader. What changes when that reader can buy?
Read the manifesto