The planogram is a promise.
 Pratham Bhatnagar
Every shelf in a modern store is drawn before it's built - which product, which row, how many facings. Then reality happens to it. On what a planogram is, why it breaks, and what it takes to finally see the gap.
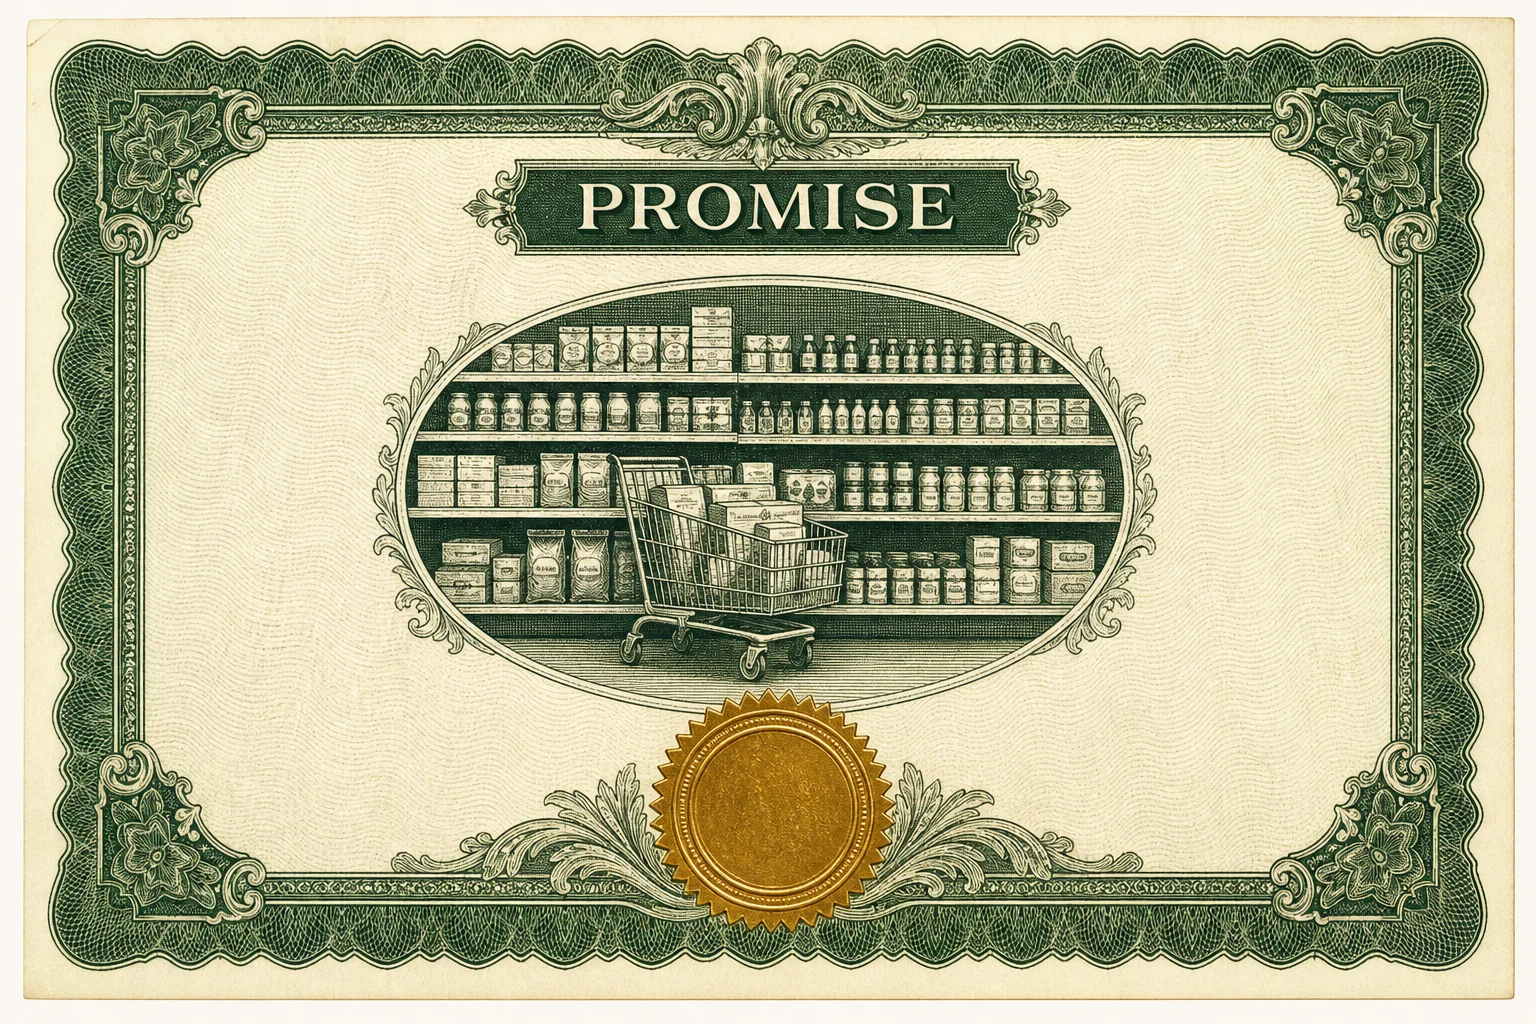
Walk into any supermarket and you're looking at a document. Before a single product touched that shelf, someone at head office drew it: this SKU at eye level with four facings, that one on the row below with three, the private label down where the price-hunters look. The drawing has a name - a planogram - and a retailer of any size runs on thousands of them, one for every shelf in every store.
A planogram is really a stack of promises. To suppliers, some of whom pay real money for specific positions, it promises the position exists. To the merchandising team it promises that shelf space - the scarcest asset a store has - is allocated by evidence instead of habit. And to the store itself it promises that the layout standing on the floor is the one the numbers said would earn the most.
The rows are not equal, which is what makes the promise expensive. Eye level outsells the rows below it by a wide margin - eye level is buy level is the oldest cliché in merchandising, and it keeps being true. A planogram is how a retailer decides who gets that scarce, valuable height and who lives near the floor. Get it right and the same shelf makes more money with the same products.
Then the floor happens to it. A delivery misses and a neighbouring product spreads into the gap. A rushed reset cuts a facing to fit a promo. A stockroom substitution puts the wrong variant in the right slot. A competitor's merchandiser - this is a real job - nudges their brand a shelf higher. None of these is dramatic. Each one moves the shelf a little further from the plan, and every store drifts in its own direction.
Retail has a word for what's actually standing on the shelf: the realogram. The planogram is the plan; the realogram is the truth. The gap between them is where paid placements quietly stop existing, where the best row in the store carries the product that earns the least, and where a category review ends up arguing about a layout no store is actually running.
Walk into any supermarket and you're looking at a document.
What keeps the gap open isn't ignorance - every retailer knows drift happens. It's the cost of looking. Checking a realogram means standing in front of the shelf with the plan in hand, comparing facing by facing. Multiply that by every aisle, every store, every week, and honesty gets expensive. So compliance gets sampled: a few stores, a few categories, a few times a year. The rest is assumed.
Closing the loop
This is the problem we built Retail Planogram around. The mechanics are short: someone on the floor photographs a shelf with a phone. The software reads the photo into a structured realogram - every product identified against the catalogue, priced, counted, laid out row by row. A person confirms what it found.
- Crop
- Detect
- Find labels
- Identify
- Read labels
- Match SKU
- Build layout
One photo in, a structured shelf out. Shown on a fictional demo store.
Once the realogram is data, the comparison that used to take a clipboard takes nothing at all. The shelf as-built diffs against the shelf as-planned, store by store, as often as someone takes a photo. And because every facing ties to live sales, the diff comes with a price on it - not just this shelf drifted, but this drift is what it's costing you.
That last part changes how the planogram itself gets made. When you can see what each row and each slot actually earns, the next revision stops being an argument between instincts and becomes a redraw against evidence. The plan improves because, for the first time, it's being graded.
Two years ago this was a research project. The open vision models that read a dense shelf - detection, segmentation, the newer grounding models that can find a specific product in a messy scene - crossed the useful threshold recently, and quickly. The clipboard era of shelf compliance is ending not because retailers changed, but because looking finally got cheap.
Pratham Bhatnagar, July 2026.
Dashboards shown are recreated on a fictional demo store. The retailer, store names, and sales figures are invented.
Read your own shelves.
If you run stores, or supply them, write to us and we will walk you through the demo.
Write to us